
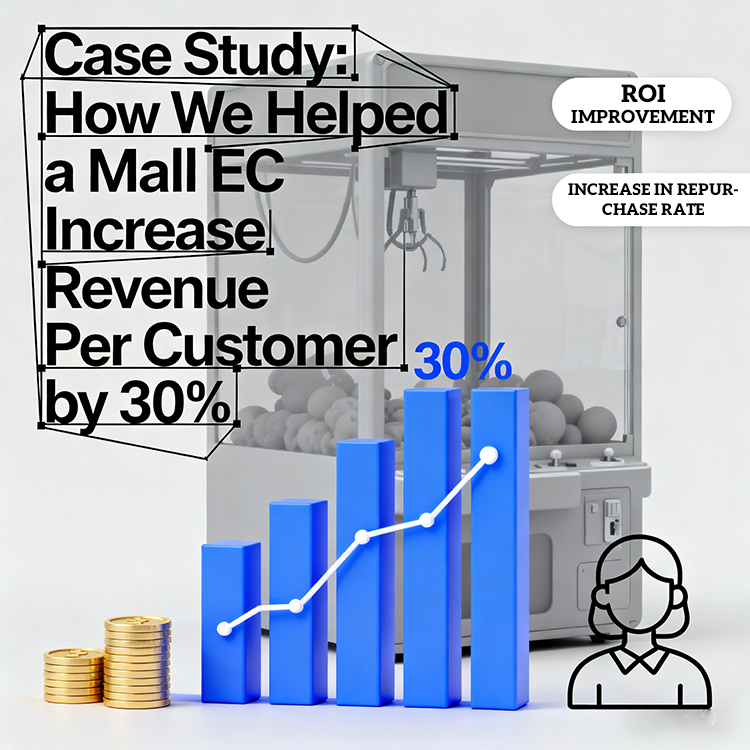
See a real-world example of revenue growth. Discover the strategic game mix and data-driven approach we used to help a client’s mall-based arcade achieve a 30% higher spend per visitor.
In the competitive environment of a shopping mall, an Entertainment Center (EC) must work harder to capture attention and spending. This case study details how we partnered with a client to transform their space, not by expanding it, but by optimizing their game mix and strategy for maximum profitability.
The Challenge: Stagnant Revenue in a Prime Location
The client’s mall EC had a solid location but was struggling with flat revenue. While foot traffic was decent, the average spend per customer was low. The existing mix of coin-operated sports games, claw machines, and bulk candy cranes failed to encourage longer visits or higher spending.
Our Strategic Solution: A Balanced “Ecosystem” of Games
We conducted an on-site audit and proposed a complete overhaul based on creating a balanced player journey. We moved beyond a simple collection of machines to curate a strategic portfolio:
High-Engagement Starters: We placed eye-catching coin-operated sports simulators near the entrance to immediately engage passersby with dynamic action.
The Core Experience: We revitalized the classic claw machine and prize crane section with modern, reliable equipment stocked with licensed潮玩 (trendy toy) IPs, dramatically increasing their appeal.
The Destination Driver: The centerpiece of the redesign was the strategic placement of our advanced self-service redemption terminals. These machines were integrated with a card system, serving as the hub where players could accumulate and redeem tickets from various games.
The Implementation: Technology and Data as the Backbone
Key to the success was the implementation of a unified card system across all key machines, including the toy vending machines and clip-on prize dispensers. This system allowed the client to:
Track which games were the biggest ticket generators.
Understand player flow and dwell time in different zones.
Run targeted promotions, such as “Double Tickets on Basketball Pro,” to drive traffic to specific areas during off-peak hours.
The Tangible Results: A Data-Backed Victory
Within three months of the redesign, the client reported transformative results:
A 30% increase in average revenue per customer (ARPC).
A 20% increase in average visit duration, as players engaged with multiple games to accumulate tickets.
A significant boost in prize redemption, confirming higher overall engagement and satisfaction.
This case proves that strategic planning and the right technology partnership are more critical than square footage. By creating a cohesive gaming ecosystem with data at its core, we helped our client unlock significant hidden revenue potential.


Add comment