


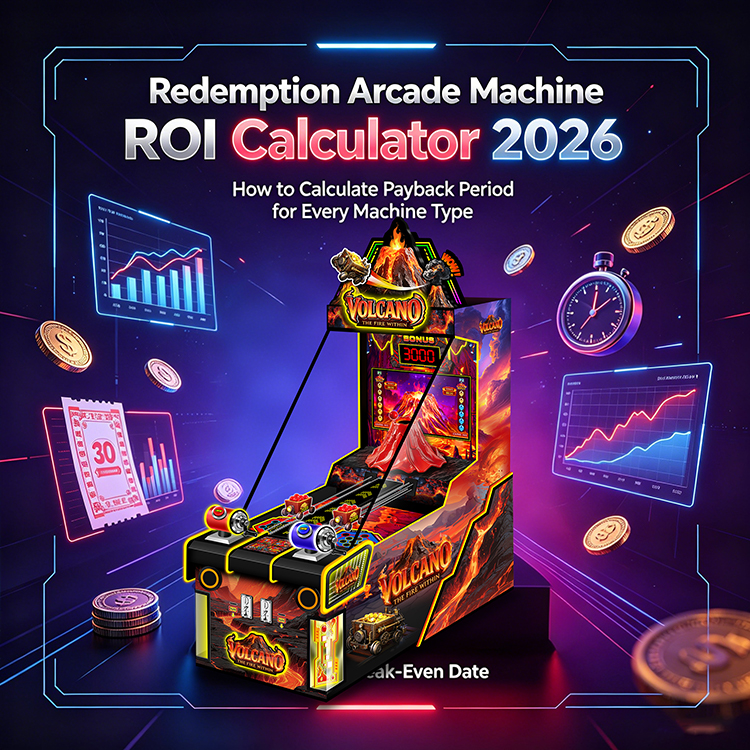
Todo comprador de máquinas de canje comerciales tarde o temprano debe responder la misma pregunta ante su socio comercial, prestamista o comité de inversión: “¿En cuánto tiempo recupera esta máquina su coste y cuál es la rentabilidad a largo plazo?”
Esta es la pregunta que determina si se firma o no una orden de compra. Y la respuesta depende de la categoría de la máquina, el flujo de clientes, la estrategia de precios y la disciplina operativa, no de las afirmaciones de marketing del fabricante.
La verdadera pregunta del comprador: más allá de "¿Es rentable?"
Perspectiva del comprador: Los nuevos inversores en FEC suelen hacer la pregunta equivocada. Preguntan: "¿Esta máquina de canje comercial generará ganancias?" (Sí, casi siempre). La pregunta correcta es: “¿Cuántos meses de funcionamiento tarda esta máquina en recuperar su coste de adquisición, y cuál es el retorno esperado por dólar invertido en 5 años?”
Son preguntas diferentes con respuestas diferentes dependiendo de:
- Costo de compra de la máquina y costo de adquisición
- Tráfico y datos demográficos del recinto
- Precio por jugada (que varía enormemente según el mercado)
- Relación boleto-premio (COGS)
- Colocación de la máquina en el suelo
- Costos locales de mano de obra y servicios públicos
La fórmula estándar de retorno de la inversión para máquinas recreativas
El marco básico:
Periodo de recuperación de la inversión (meses) = Coste de adquisición de la máquina ÷ Ingresos netos mensuales por máquina
Dónde:
Costo de la máquina aterrizada
- = Precio de compra FOB + flete + arancel + impuesto + entrega local
Ingresos netos mensuales
- = (Ingresos brutos semanales × 4,33) − Costo de los bienes vendidos mensuales − Gastos generales asignados mensualmente por máquina
Para obtener un retorno de la inversión (ROI) completo a 5 años, calculamos:
Retorno de la inversión a 5 años (%) = [(Ingresos totales a 5 años − Costos totales a 5 años) ÷ Costo de adquisición de la máquina] × 100
Los datos de entrada para estas fórmulas provienen de datos operativos reales. Analicemos cada dato de entrada por categoría de máquina.
Indicadores de ingresos por categoría de máquina (datos de cultivos de girasol)
Perspectiva del ingeniero de diseño de Sunflower: Estos son los rangos de ingresos semanales reales observados en los operadores de centros de entretenimiento familiar que utilizan la máquina de canje comercial Sunflower. Los rangos reflejan la diferencia entre la baja afluencia de público entre semana y la alta afluencia de público los fines de semana, así como entre los establecimientos consolidados con clientes habituales y los establecimientos más nuevos que aún están captando clientes.
Categoría 1: Juegos de habilidad de canje para un solo jugador
Rango de ingresos brutos semanales:
- USD 220 – 480
Promedio típico (local para adultos):
- 320 dólares estadounidenses por semana
Potencial de semana pico (vacaciones/eventos):
- USD 550+
Precio por partida (típico):
- USD 0,50 – 1,50
Categoría 2 — Máquinas de empujar monedas para un solo jugador
Rango de ingresos brutos semanales:
- USD 280 – 620
Promedio típico (local para adultos):
- 420 dólares estadounidenses por semana
Potencial de semana pico:
- Más de 750 USD
Precio por partida (típico):
- USD 0,25 – 1,00 por moneda
Categoría 3 — Máquinas de empujar monedas multijugador (4 estaciones)
Rango de ingresos brutos semanales:
- USD 650 – 1.400
Promedio típico (local para adultos):
- 950 dólares estadounidenses por semana
Potencial de semana pico:
- Más de 1800 USD
Precio por partida (típico):
- USD 0,50 – 1,50 por moneda, por jugador
Categoría 4 — Máquinas tragamonedas grandes para múltiples jugadores
Rango de ingresos brutos semanales:
- USD 800 – 1.800
Promedio típico (local para adultos):
- 1250 dólares estadounidenses por semana
Potencial de semana pico:
- Más de 2400 USD
Precio por partida (típico):
- USD 1,00 – 4,00
Categoría 5 — Máquinas expendedoras de premios / Máquinas de grúa
Rango de ingresos brutos semanales:
- USD 180 – 420
Promedio típico (local para adultos):
- 275 dólares estadounidenses por semana
Potencial de semana pico:
- USD 550+
Precio por partida (típico):
- USD 1,00 – 3,00
Categoría 6 — Juegos de canje para niños
Rango de ingresos brutos semanales:
- USD 140 – 320
Promedio típico (local para adultos):
- 220 USD por semana
Potencial de semana pico:
- USD 450+
Precio por partida (típico):
- USD 0,50 – 1,00
Cálculos completos del retorno de la inversión por tipo de máquina
Vamos a elaborar cálculos completos de retorno de la inversión para cada categoría, utilizando supuestos de entrada realistas.
Cálculo del ROI 1: Juego de habilidad de canje para un solo jugador
Entradas:
- Precio FOB: 3.200 USD
- Costo de desembarque (margen de 25% por flete/aranceles/gastos locales): USD 4.000
- Ingresos brutos semanales típicos (local consolidado): 320 USD
- Ingresos brutos mensuales (× 4,33): 1.386 USD
- Costo de los bienes vendidos (costo del premio en 22%): USD 305
- Gastos generales del local asignados por máquina (alquiler/servicios/mano de obra): 180 USD
Ingresos netos mensuales por máquina: 901 USD
Periodo de recuperación de la inversión: 4.000 USD ÷ 901 USD = 4,4 meses
Retorno de la inversión a 5 años:
- Ingresos brutos en 5 años: USD 83.160
- Costos totales a 5 años (costo de los bienes vendidos + gastos generales + mantenimiento previsto): USD 34.150
- Beneficio neto a 5 años: 49.010 USD
Retorno de la inversión a 5 años: 1,225%
Cálculo del ROI 2 — Máquina de empujar monedas multijugador (4 estaciones)
Entradas:
- Precio FOB: 8.500 USD
- Coste de desembarque: 10.625 USD
- Ingresos brutos semanales típicos: 950 USD
- Ingresos brutos mensuales: 4.114 USD
- Costo de los bienes vendidos (22%): USD 905
- Gastos generales asignados: 240 USD
Ingresos netos mensuales por máquina: USD 2.969
Periodo de recuperación de la inversión: 10.625 USD ÷ 2.969 USD = 3,6 meses
Retorno de la inversión a 5 años:
- Ingresos brutos en 5 años: USD 246.840
- Coste total a 5 años: 96.300 USD
- Beneficio neto a 5 años: 150.540 USD
Retorno de la inversión a 5 años: 1,417%
Cálculo del ROI 3 — Máquina tragamonedas principal / Gabinete multijugador grande
Entradas:
- Precio FOB: 14.000 USD
- Coste de desembarque: 17.500 USD
- Ingresos brutos semanales típicos: 1250 USD
- Ingresos brutos mensuales: USD 5.413
- Costo de los bienes vendidos (22%): USD 1.191
- Gastos generales asignados: 320 USD
Ingresos netos mensuales por máquina: USD 3.902
Periodo de recuperación de la inversión: 17.500 USD ÷ 3.902 USD = 4,5 meses
Retorno de la inversión a 5 años:
- Ingresos brutos en 5 años: USD 324.780
- Coste total a 5 años: 128.760 USD
- Beneficio neto a 5 años: 196.020 USD
Retorno de la inversión a 5 años: 1,120%
Cálculo del ROI 4 — Máquina expendedora de premios / Máquina de grúa
Entradas:
- Precio FOB: 2200 USD
- Costo de importación: USD 2.750
- Ingresos brutos semanales típicos: 275 USD
- Ingresos brutos mensuales: 1.191 USD
- Costo de los bienes vendidos (28% para máquinas expendedoras de premios; mayor porque los premios son más visibles/premium): USD 333
- Gastos generales asignados: 120 USD
Ingresos netos mensuales por máquina: 738 USD
Periodo de recuperación de la inversión: 2750 USD ÷ 738 USD = 3,7 meses
Retorno de la inversión a 5 años:
- Ingresos brutos en 5 años: USD 71.460
- Coste total a 5 años: 28.600 USD
- Beneficio neto a 5 años: 42.860 USD
Retorno de la inversión a 5 años: 1,559%
Cálculo del retorno de la inversión 5: Juego de canje para niños
Entradas:
- Precio FOB: 1.800 USD
- Costo de importación: USD 2.250
- Ingresos brutos semanales típicos: 220 USD
- Ingresos brutos mensuales: 953 USD
- Costo de los bienes vendidos (22%): USD 210
- Gastos generales asignados: 90 USD
Ingresos netos mensuales por máquina: 653 USD
Periodo de recuperación de la inversión: 2250 USD ÷ 653 USD = 3,4 meses
Retorno de la inversión a 5 años:
- Ingresos brutos en 5 años: USD 57.180
- Coste total a 5 años: 21.600 USD
- Beneficio neto a 5 años: 35.580 USD
Retorno de la inversión a 5 años: 1.581%
Cronograma de recuperación realista: Progresión semanal
Perspectiva del comprador: Los cálculos anteriores muestran periodos de recuperación de la inversión cortos, pero la planificación empresarial real debe tener en cuenta el periodo de adaptación del local. Los locales nuevos no generan ingresos estables desde el primer día.
Curva típica de progresión de ingresos para un nuevo centro de entretenimiento familiar (FEC):
| Mes de operación | Ingresos % de nivel maduro | Ingresos netos acumulados (por máquina de USD 4.000) |
| Mes 1 | 35% | 315 dólares estadounidenses |
| Mes 2 | 55% | USD 810 |
| Mes 3 | 70% | USD 1.441 |
| Mes 4 | 82% | USD 2.180 |
| Mes 5 | 90% | USD 2.991 |
| Mes 6 | 95% | 3.847 dólares estadounidenses |
| Mes 7 | 98% | 4.731 dólares estadounidenses |
| Mes 8+ | 100% | Estado estable |
Para nuestro ejemplo de Categoría 1 (costo de adquisición de USD 4000, ingresos netos mensuales de USD 901 al vencimiento), el período de recuperación realista se sitúa en Mes 7 — no el mes 4.4. La cifra de 4.4 meses se aplica a locales consolidados que compran máquinas de reemplazo o adicionales, no a empresas emergentes de primer año.
Período de recuperación realista específico para cada categoría (teniendo en cuenta el período de ajuste):
| Categoría | Costo de desembarque | Venganza madura | Recuperación de la inversión ajustada por rampa (Nuevo emplazamiento) |
| Canje para un solo jugador | 4.000 dólares estadounidenses | 4,4 meses | 7 meses |
| Máquina de empujar monedas para un solo jugador | 4.600 dólares estadounidenses | 4,0 meses | 6,5 meses |
| Máquina de empujar monedas multijugador | 10.625 dólares estadounidenses | 3,6 meses | 6 meses |
| Armario de anclaje | 17.500 dólares estadounidenses | 4,5 meses | 7,5 meses |
| Máquina expendedora de premios | USD 2.750 | 3,7 meses | 6 meses |
| Redención de los niños | USD 2.250 | 3,4 meses | 5,5 meses |
Las palancas que acortan el período de recuperación de la inversión
Perspectiva del ingeniero de diseño de Sunflower: Los compradores que recuperan su inversión más rápidamente no solo compran mejores máquinas, sino que también las operan mejor. Según nuestros datos de campo, estos factores operativos son los que marcan la mayor diferencia:
Palanca 1: Disciplina de precios (aumento de ingresos de +201 TP3T a +451 TP3T)
La mayoría de los nuevos operadores subestiman el precio de sus máquinas. Los clientes de los centros de entretenimiento familiar (FEC), especialmente en aquellos orientados a la familia, son menos sensibles al precio de lo que suponen los operadores. Pasar de 0,50 USD a 0,75 USD por partida suele generar un aumento de ingresos de entre 30 y 351 TP3T con una disminución del volumen de solo entre 5 y 101 TP3T.
Nivel 2: Ubicación óptima en planta (+15% a +30% de aumento de ingresos)
Las máquinas ubicadas en lugares de alta visibilidad y mucho tránsito (cerca de la entrada, cerca del servicio de comidas, cerca de los baños) generan entre 15 y 30¹²³ más ingresos que máquinas idénticas ubicadas en rincones poco visibles. La ubicación estratégica es dinero fácil.
Nivel 3: Optimización del pago de tickets (mejora del margen de 5% a 12%)
Las máquinas calibradas al rango óptimo de 20–25% de COGS maximizan las ganancias. Las máquinas que pagan a partir de 30% reducen el margen de beneficio sin aumentar significativamente la satisfacción del jugador. Las máquinas que pagan por debajo de 18% frustran a los jugadores y disminuyen la frecuencia de juego. Todas las máquinas comerciales Sunflower se entregan con ratios de pago ajustables por el operador.
Palanca 4: Integración del sistema sin efectivo (aumento de ingresos de +151 TP3T a +251 TP3T)
Las máquinas que aceptan pagos sin efectivo superan sistemáticamente a sus equivalentes que solo aceptan monedas en un 15-251% porque:
- Los jugadores recargan sus tarjetas con billetes de mayor denominación que los que usarían para introducir efectivo.
- Sin fricción alguna al buscar monedas
- El impulso de "jugar una vez más" es más fácil con saldo en la tarjeta que entregando efectivo.
- Los datos permiten precios dinámicos durante las horas pico.
Palanca 5: Disciplina de mantenimiento preventivo (reduce el costo por tiempo de inactividad entre 60 y 80 TP3T)
Una máquina parada por reparación no genera ingresos. Los operadores con programas de mantenimiento rigurosos experimentan entre 4 y 6 días de inactividad no programada al año; los operadores sin mantenimiento experimentan entre 15 y 25 días al año. Esa diferencia representa entre 700 y 2500 dólares estadounidenses por máquina al año en pérdidas de ingresos.
El modelo de inversión total a 5 años
Vamos a construir un modelo realista de 5 años para una máquina tragamonedas multijugador Sunflower Tier 3, teniendo en cuenta el período de puesta en marcha, los costos continuos y la vida útil de la máquina:
| Artículo | Valor |
| Costo de adquisición (Año 0) | 10.625 dólares estadounidenses |
| Ingresos brutos del año 1 (con ajuste por inflación) | 34.500 dólares estadounidenses |
| Ingresos brutos del año 2 (maduros) | 49.400 dólares estadounidenses |
| Ingresos brutos del año 3 | 49.400 dólares estadounidenses |
| Ingresos brutos del año 4 | 49.400 dólares estadounidenses |
| Ingresos brutos del año 5 | 49.400 dólares estadounidenses |
| Ingresos brutos totales de 5 años | USD 232.100 |
| Costo total de los bienes vendidos (22%) | 51.062 dólares estadounidenses |
| Gastos generales totales asignados | 14.400 dólares estadounidenses |
| Mantenimiento completo (máquina de nivel 3) | USD 850 |
| Costos totales a 5 años | USD 66.312 |
| Beneficio neto a 5 años | 165.788 dólares estadounidenses |
| Valor de reventa estimado en el quinto año. | 4.500 dólares estadounidenses |
| Retorno de la inversión a 5 años (con reventa) | 1,605% |
| Periodo de recuperación de la inversión (ajustado por rampa) | 6 meses |
Este es un caso de negocio realista y defendible para una máquina de canje comercial. Si lo multiplicamos por todo un centro de entretenimiento familiar (normalmente entre 40 y 80 máquinas), la rentabilidad a nivel de todo el establecimiento se hace evidente.
¿Qué preguntas deberían hacerse los distribuidores e inversores antes de comprar?
Los compradores serios someten a prueba sus modelos de retorno de la inversión antes de firmar una orden de compra:
¿Cuáles son los ingresos previstos en el "peor escenario realista" para este local?
1. (Normalmente entre el 55 y el 65% de los ingresos proyectados en la fase madura). ¿La máquina aún se amortiza en 24 meses a ese ritmo?
¿Cuál es mi costo real de entrega, incluyendo todos los gastos de flete, aranceles, impuestos y envío?
2. No solo el precio FOB.
¿Cuál es mi ratio de COGS real?
3. Realizar un seguimiento semanal de esto; ajustar la fuente de premios si se desvía por encima de 25%.
¿Qué tasa de tiempo de inactividad estoy asumiendo?
4. Una máquina de nivel 3 con el mantenimiento adecuado funciona más de 340 días al año. Una máquina de nivel 1 funciona entre 300 y 320 días al año.
¿Cuál es mi estrategia de salida?
5. Si necesito vender esta máquina en el año 3, ¿cuál es su valor de reventa realista? Las máquinas comerciales de nivel 3 conservan su valor; las de nivel 1 no.
Caso de inversión de Sunflower Machine
Las máquinas comerciales de Sunflower Amusement están diseñadas específicamente para el comprador que busca maximizar el retorno de la inversión. Nuestras decisiones de diseño —componentes de calidad comercial, vida útil de 8 a 12 años, garantía de 12 meses y disponibilidad de repuestos durante más de 7 años— se traducen directamente en resultados de retorno de la inversión:
Menor costo total de propiedad
- porque la fiabilidad reduce el tiempo de inactividad y el mantenimiento.
Mayor valor de reventa
- porque la ingeniería de primera calidad resiste
Recuperación de la inversión más rápida
- porque el tiempo de actividad operativa es mayor
Vida productiva más prolongada
- — máquinas que siguen generando ingresos después de más de 8 años frente a alternativas de ahorro de costes que requieren reemplazo al cuarto año.
Para los distribuidores y las cadenas de centros de entretenimiento familiar, esto significa que las máquinas Sunflower ofrecen perfiles de retorno de la inversión consistentemente sólidos que respaldan tanto las primeras compras como los pedidos repetidos.
¿Quieres crear un modelo de retorno de la inversión real para el lugar que te interesa? Solicite la plantilla de hoja de cálculo de ROI de Sunflower personalizado según su combinación de máquinas y mercado, o Consulte nuestro catálogo comercial. para identificar las referencias (SKU) adecuadas para su caso de inversión.
Preguntas frecuentes
P: ¿Cuál es el período de recuperación de la inversión típico para una máquina recreativa comercial de canje de premios? A: Para un local consolidado, el plazo de recuperación de la inversión es de 4 a 6 meses para la mayoría de las máquinas comerciales Sunflower Tier 3. Para un local nuevo, teniendo en cuenta el aumento gradual de los ingresos, el plazo realista es de 6 a 9 meses. La recuperación de la inversión es más rápida para las máquinas multijugador y los juegos de canje de premios para niños; más lenta para las máquinas tragamonedas de alto costo en locales con poco tráfico.
P: ¿Cuánto dinero genera una sola máquina recreativa por semana? A: Dependiendo de la categoría y el flujo de clientes: USD 140–320 para juegos de canje para niños, USD 220–480 para juegos de habilidad para un solo jugador, USD 280–620 para máquinas de empujar monedas para un solo jugador, USD 650–1400 para máquinas de empujar monedas para varios jugadores, USD 800–1800 para gabinetes principales, USD 180–420 para máquinas expendedoras de premios.
P: ¿Cuál es un buen retorno de la inversión (ROI) a 5 años para una máquina recreativa? A: Una máquina comercial Sunflower Tier 3 bien operada suele generar un retorno de la inversión (ROI) de entre 1000 y 1600 TP3T a cinco años (es decir, un retorno de 10 a 16 veces el costo de adquisición) en un recinto consolidado. Las máquinas con costos reducidos pueden generar ingresos máximos similares, pero pierden entre 15 y 25 TP3T de ROI debido a tiempos de inactividad y una vida útil más corta.
P: ¿Cómo afecta la relación precio del boleto/premio (COGS) al retorno de la inversión (ROI)? R: Significativamente. Un COGS de 22% (el punto óptimo del sector) mantiene un margen bruto de 78%. Un COGS de 30% reduce el margen bruto a 70%, lo que supone una reducción relativa de 10% en el beneficio bruto y una reducción aproximada de 15% en la velocidad de recuperación de la inversión. Todas las máquinas Sunflower comerciales se envían con parámetros de pago ajustables por el operador para ayudar a mantener el COGS objetivo.
P: ¿Las máquinas multijugador realmente generan ganancias más rápido que las de un solo jugador? R: Sí, normalmente. Las máquinas multijugador cuestan más por unidad, pero generan entre 2,5 y 3,5 veces más ingresos que una máquina individual, lo que les permite recuperar la inversión igual o incluso más rápido en la mayoría de los establecimientos. Además, generan una mayor interacción en redes sociales, lo que contribuye a aumentar el tráfico general del local.
P: ¿Qué ocurre si mi local está en una zona con poco tránsito? A: Ajuste el modelo de retorno de la inversión (ROI) a la baja en un 25-40% sobre las proyecciones de ingresos semanales. Los períodos de recuperación se extienden en consecuencia (un período de recuperación de 6 meses se convierte en 9-10 meses). Las máquinas siguen siendo rentables, solo que más lentamente. Considere comenzar con máquinas de menor costo y mayor rotación (juegos de habilidad para un solo jugador, máquinas expendedoras de premios) en lugares con poco tráfico en lugar de grandes gabinetes de anclaje.
P: ¿Cómo afecta la ingeniería de Sunflower al retorno de la inversión en comparación con las alternativas de reducción de costes? R: De dos maneras. (1) Mayor tiempo de actividad: las máquinas de grado comercial funcionan más de 340 días al año, frente a los 300-320 días de las máquinas de bajo costo, lo que añade entre 700 y 2500 USD en ingresos anuales por máquina. (2) Mayor vida útil: las máquinas comerciales generan ingresos durante 8-12 años, frente a los 3-5 años de las máquinas de bajo costo, lo que extiende drásticamente la rentabilidad total a lo largo de su vida útil.
Sugerencias de enlaces internos:
- → Contáctanos – Sunflower Amusement
- → Calculadora de ROI para máquinas de canje comerciales 2026: Cómo calcular el período de recuperación de la inversión para cada tipo de máquina – Sunflower Amusement
- → Servicio de emergencia 48 horas para máquinas recreativas: Cómo la red de soporte global de Sunflower mantiene su local en funcionamiento – Sunflower Amusement
- → Producto – Diversión Girasol
- →IAAPA | La Asociación Global de la Industria de las Atracciones

Añadir comentario